top of page

Search


Jan 20, 20233 min read
Python Data Analysis Guided Project - Analyze Dog Breeds, Level 2, 31 min
DataSimple.education Certifications Data Analysis, Pandas, Seaborn, Plotly and More In this Python data analysis guided project, we will...
1,481 views
0 comments


Jan 18, 20232 min read
Python Data Analysis Tips - Anomaly Detection Plot in Seaborn
DataSimple.education Certifications Data Analysis, Pandas, Seaborn, Plotly and More In Python with Seaborn learn how to make an anomaly...
3,577 views
0 comments


Dec 13, 20222 min read
Python ML Guided Project Credit Card Approvals Classification - Level 4, 40 min
In this supervised learning Python ML guided project we will be predicting whether or not someone was approved for a credit card. In...
619 views
2 comments

Dec 12, 20222 min read
Python Machine Learning Guided Project Cell Phone Price Prediction - Level 3, 30 minutes
In the Python Project, we will use Pandas and Seaborn to perform our exploratory data analysis in en effort to understand how our...
118 views
0 comments
Dec 12, 20222 min read
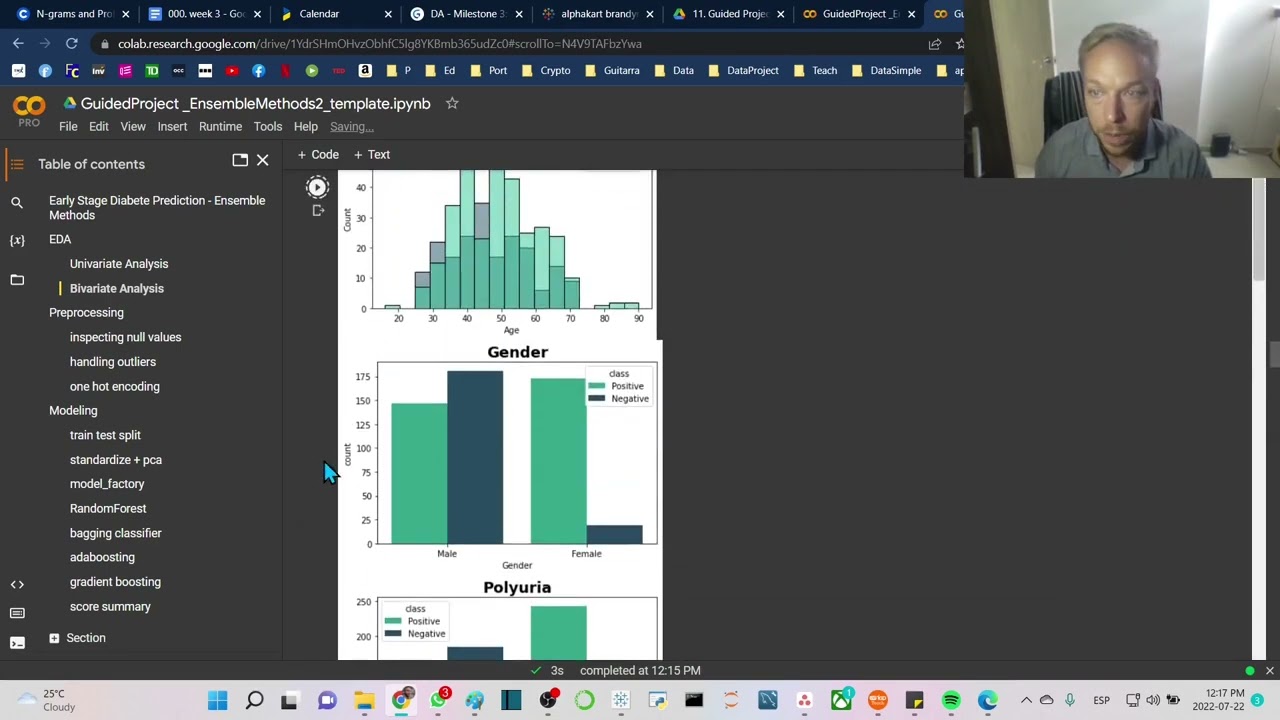
Python Machine Learning Guided Project, Early Diabetes Prediction - Level 2, 15 minutes
Follow along with this Python ML-guided project. In this beginner Python project, we build a classification model in Sklearn to predict...
39 views
0 comments


Dec 12, 20221 min read
Python Data Analysis Guided Project Drugged Islanders, Level 1, 19 minutes
On this beginner-guided instructional project in Python we will explore with our Python data analysis skills what happened to the...
2,123 views
0 comments


Dec 10, 20222 min read
Python Computer Vision Guided Project - Tensorflow Rock Paper Scissor, Level 4, 35 minutes
This Python computer vision project is a minimal level of difficulty to get computer vision to work well. Overfitting in computer...
396 views
1 comment

Dec 5, 20221 min read
Python Data Analysis Tips FacetGrid in Seaborn apply multple histplot violinplot hue
learn how to use seaborn FacetGrid with seaborn histplot and violinplot . the FacetGrid allows you to with the help of the argument hue,...
229 views
0 comments


Dec 3, 20221 min read
Python Data Analysis learn how to control the sub-plotting functions while using Seaborn's jointplot
This modern-day scatterplot allows us to extract valuable insights but it can be tricky to get the right effect. learn the ins and outs...
2,024 views
0 comments


Dec 1, 20221 min read
Python Data Analysis Guided Project Level 4, 17min- Analyze Stores sales from Supermarket Chain
In Python Data Analysis guided project. Using the template or solution workbook follow along with me and analyze the various store in...
1,017 views
0 comments

Nov 30, 20221 min read
Python ML guided project Level 1, 24min - simple linear regression house price prediction
This intro project is great for those new to Sklearn. Learn how to set up an ML workflow. From exploratory data analysis to predictions....
5,626 views
1 comment


Nov 28, 20221 min read
data analysis tips - displot in seaborn. groupby categories to inspect lower level distributions
use the displot in seaborn to inspect your distributions grouping by up to 3 categories to allow you to inspect the distributions by each...
157 views
0 comments

Nov 26, 20221 min read
Python data analysis guided project spaceship titanic data analysis for machine learn 31 min level 8
Data Analysis Guided Project in Python. Use your data analysis skills and analyze the spaceship titanic data from Kaggle Competition as...
490 views
0 comments

Nov 25, 20221 min read
Python Data Analysis Tips swarmplot how when why to use a Seaborn swarmplot
Python beginner data analysis tips on how to use seaborn swarmplot() . Learn why you would use this distribution plot versus other types...
2,021 views
0 comments

Nov 25, 20221 min read
Python Data Analysis Tips countplot why use Seaborn's countplot
Learn to use Seaborn's countplot(). One of the few plots we can use directly on category columns. understanding the balance or...
34 views
0 comments

Nov 25, 20221 min read
python data analysis tips boxenplot how when why to use a boxenplot
With Python, learn to use the boxenplot() in seaborn and a modern combination of a box and histogram() plot. learn when, why, and how to...
555 views
0 comments

Nov 23, 20221 min read
Python Data Analysis guided project - Sri Lanka Economic Analysis. Level 7, 26 min
Study what happened to the Sri Lanka economy with python from 1966 to 2022 and see if you can understand what lead to the high inflation...
435 views
0 comments
Nov 23, 20221 min read
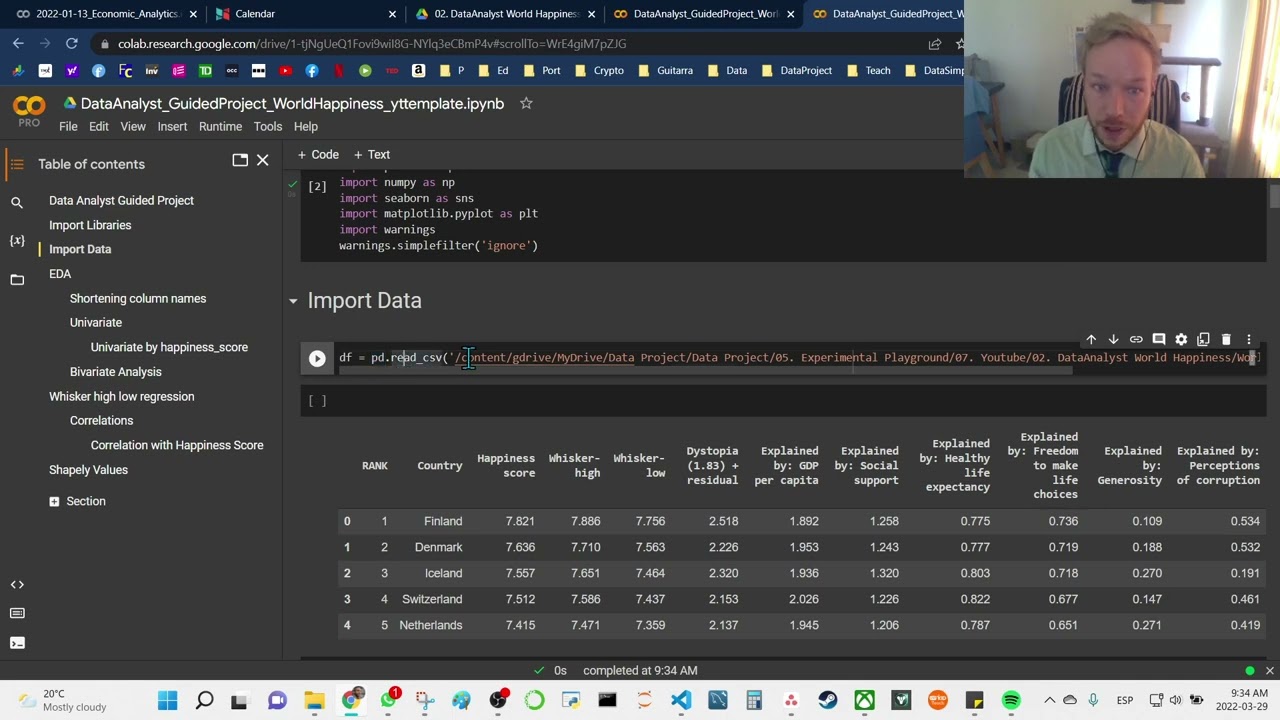
Python data analysis guided project - world happiness index - level 5, 30 min
Use pandas and seaborn in Python to analyze the world happiness index and better understand what affect a countries happiness by...
36 views
0 comments

Nov 16, 20221 min read
Python Data Analysis Tips - Seaborn barplot
Join data science teacher brandyn as we learn how, why and when to use seaborn's barplot. How to extract the most valuable insights in...
49 views
0 comments
bottom of page